Now that we’ve seen the basics, let’s break it all down with a more formal introduction of Python Matplotlib’s Object-Oriented API. This means we will instantiate figure objects and then call methods or attributes from that object.
Introduction to the Object-Oriented Method
The main idea in using the more formal Object Oriented method is to create figure objects and then just call methods or attributes off of that object. This approach is nicer when dealing with a canvas that has multiple plots on it.
To begin we create a figure instance. Then we can add axes to that figure:
# Create Figure (empty canvas)
fig = plt.figure()

# Add set of axes to figure
axes = fig.add_axes([0.1, 0.1, 0.8, 0.8]) # left, bottom, width, height (range 0 to 1)

# Plot on that set of axes
axes.plot(x, y, 'b')
axes.set_xlabel('Set X Label') # Notice the use of set_ to begin methods
axes.set_ylabel('Set y Label')
axes.set_title('Set Title')
Output:

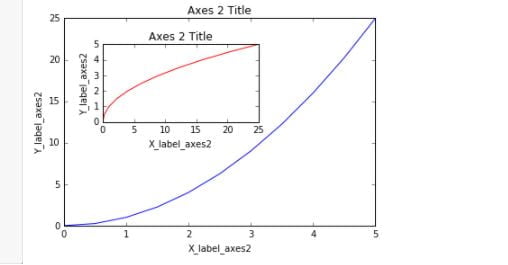
Code is a little more complicated, but the advantage is that we now have full control of where the plot axes are placed, and we can easily add more than one axis to the figure:
# Creates blank canvas
fig = plt.figure()

axes1 = fig.add_axes([0.1, 0.1, 0.8, 0.8]) # main axes
axes2 = fig.add_axes([0.2, 0.5, 0.4, 0.3]) # inset axes

# Larger Figure Axes 1
axes1.plot(x, y, 'b')
axes1.set_xlabel('X_label_axes2')
axes1.set_ylabel('Y_label_axes2')
axes1.set_title('Axes 2 Title')

# Insert Figure Axes 2
axes2.plot(y, x, 'r')
axes2.set_xlabel('X_label_axes2')
axes2.set_ylabel('Y_label_axes2')
axes2.set_title('Axes 2 Title');
Python Matplotlib subplots()
The plt.subplots() object will act as a more automatic axis manager.
Basic use cases:
# Use similar to plt.figure() except use tuple unpacking to grab fig and axes
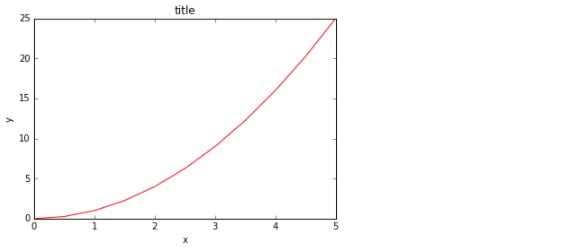
fig, axes = plt.subplots()

# Now use the axes object to add stuff to plot
axes.plot(x, y, 'r')
axes.set_xlabel('x')
axes.set_ylabel('y')
axes.set_title('title');
Then you can specify the number of rows and columns when creating the subplots() object:
# Empty canvas of 1 by 2 subplots
fig, axes = plt.subplots(nrows=1, ncols=2)
# Axes is an array of axes to plot on
axes
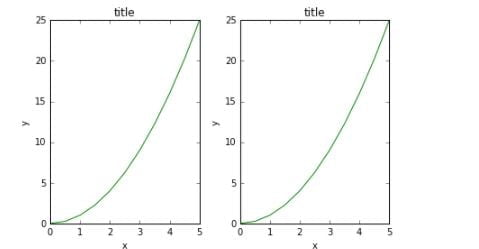
A common issue with matplolib is overlapping subplots or figures. We can use fig.tight_layout() or plt.tight_layout() method, which automatically adjusts the positions of the axes on the figure canvas so that there is no overlapping content:
fig, axes = plt.subplots(nrows=1, ncols=2)

for ax in axes:
    ax.plot(x, y, 'g')
    ax.set_xlabel('x')
    ax.set_ylabel('y')
    ax.set_title('title')

fig
plt.tight_layout()
Figure size, aspect ratio and DPI in Python Matplotlib
Matplotlib allows the aspect ratio, DPI and figure size to be specified when the Figure object is created. You can use the figsize and dpi keyword arguments.
figsizeis a tuple of the width and height of the figure in inchesdpiis the dots-per-inch (pixel per inch).
For example:

The same arguments can also be passed to layout managers, such as the python matplotlib subplots function:
fig, axes = plt.subplots(figsize=(12,3))

axes.plot(x, y, 'r')
axes.set_xlabel('x')
axes.set_ylabel('y')
axes.set_title('title');
Further reading Of Python Matplotlib:
- http://www.matplotlib.org – The project web page for matplotlib.
- https://github.com/matplotlib/matplotlib – The source code for matplotlib.
- http://matplotlib.org/gallery.html – A large gallery showcasing various types of plots matplotlib can create. Highly recommended!
- http://www.loria.fr/~rougier/teaching/matplotlib – A good matplotlib tutorial.